
Mount Pleasant had 95,469 residents on July 1, 2025, the Census Bureau estimates, up 5.1% since the 2020 census and twice its 2000 population.
Last checked Oct. 16, 2026. Figures come from the U.S. Census Bureau: the 2010 and 2020 censuses, the Vintage 2025 city and town population estimates and the 2020-2024 American Community Survey five-year estimates. See the town’s Census QuickFacts. Questions about the town’s own planning figures: Planning, 843-884-1229.
Mount Pleasant had an estimated 95,469 residents on July 1, 2025, the Census Bureau says. That is 4,668 more people, or 5.1%, than the 90,801 counted in the 2020 census, and almost exactly twice the 47,609 counted in 2000. Mount Pleasant is the fourth-largest municipality in South Carolina, after Charleston (159,423), Columbia (147,035) and North Charleston (129,245).
At a glance
- Population: 95,469 (July 1, 2025 estimate); 90,801 (2020 census); 67,843 (2010 census)
- Growth since 2020: 5.1%, below Charleston County’s 6.9%
- Median age: 42.6
- Median household income: $124,755
- Households: about 39,884, averaging 2.34 people
- Adults with a bachelor’s degree or higher: 68.4%
Growth since 2000
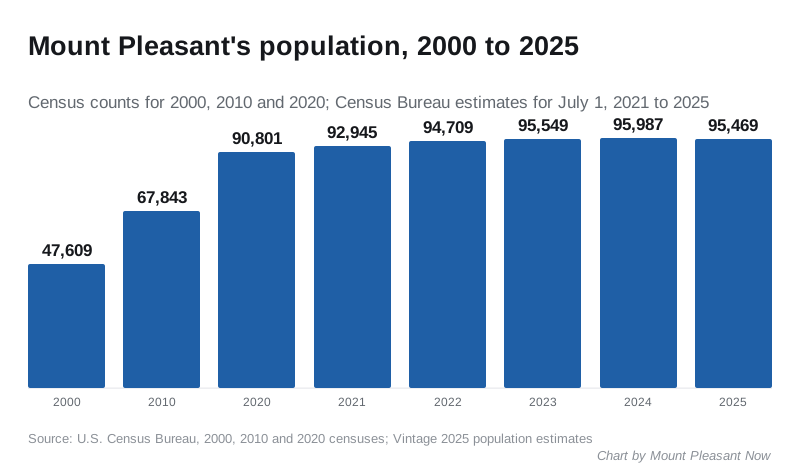
The town grew 33.8% between the 2010 and 2020 censuses, about twice as fast as Charleston County’s 16.6%. Since then growth has slowed sharply: about 1,700 more people in the year to July 2021, 1,800 in 2022, 840 in 2023 and 440 in 2024. The 2025 estimate is 518 people lower than 2024’s, the first annual drop in the series. Estimates are revised every year, so the next release may move it.
Mount Pleasant limits how many residential building permits it issues each year through its building permit allocation system; our building permits and zoning guide explains it.
Age, income and households
From the 2020-2024 American Community Survey five-year estimates (age, income, households and education, housing):
| Measure | Mount Pleasant | Charleston County |
|---|---|---|
| Population (ACS estimate) | 93,993 | 420,264 |
| Median age | 42.6 | 39.2 |
| Under 18 | 22.8% | 19.5% |
| 65 and older | 18.4% | 17.9% |
| Median household income | $124,755 | $88,494 |
| People below the poverty level | 6.1% | 11.3% |
| Households | 39,884 | 178,975 |
| Average household size | 2.34 | 2.29 |
| Adults 25+ with a bachelor’s degree or higher | 68.4% | 50.3% |
| Housing units | 44,376 | 209,803 |
| Owner-occupied homes | 73.6% | 63.9% |
| Median value, owner-occupied homes | $748,500 | $489,100 |
| Median gross rent | $2,159 | $1,620 |
The ACS figures are averages of surveys taken from 2020 to 2024, so the population total sits between the 2020 census and the 2025 estimate. Every ACS number has a margin of error, listed in the Census tables.
Mount Pleasant and its neighbors
| Place | 2020 census | 2025 estimate | Change | Median household income (ACS 2020-2024) |
|---|---|---|---|---|
| Mount Pleasant | 90,801 | 95,469 | +5.1% | $124,755 |
| Charleston | 150,227 | 159,423 | +6.1% | $92,414 |
| North Charleston | 114,852 | 129,245 | +12.5% | $62,956 |
| Hanahan | 20,325 | 22,415 | +10.3% | $87,984 |
| James Island (town) | 11,621 | 12,660 | +8.9% | $104,217 |
| Charleston County | 408,235 | 436,200 | +6.9% | $88,494 |
Mount Pleasant has the highest household income, the highest share of college graduates and the most expensive owner-occupied homes of these places, and the highest median age. It is now growing more slowly than any of its neighbors.
Where the numbers come from
- Census counts (2000, 2010 and 2020) are full counts taken every 10 years.
- Population estimates are the Census Bureau’s annual figures for July 1, built from births, deaths and migration since the last census.
- The American Community Survey samples households every year and publishes five-year averages for places of every size, with margins of error.
For home values see our home prices guide; for schools see the schools guide.
What this means for you
- Mount Pleasant doubled in size between 2000 and 2025, but growth has nearly stopped.
- Nearly three in four homes are lived in by their owners, well above the county.
- The typical owner-occupied home is worth about $748,500, the ACS says, half again the county figure.
Related guides: moving to Mount Pleasant and history and landmarks.
Frequently asked questions
What is the population of Mount Pleasant, South Carolina?
The Census Bureau estimates Mount Pleasant had 95,469 residents on July 1, 2025. The 2020 census counted 90,801.
Is Mount Pleasant the largest town in South Carolina?
It is the fourth-largest municipality in the state by the Census Bureau’s July 1, 2025, estimates, after Charleston, Columbia and North Charleston.
How fast is Mount Pleasant growing?
The town grew 33.8% between the 2010 and 2020 censuses, from 67,843 to 90,801. Growth has since slowed, and the July 2025 estimate was 518 people below 2024’s.
What is the median household income in Mount Pleasant?
$124,755 in the Census Bureau’s 2020-2024 American Community Survey, compared with $88,494 for Charleston County.
What is the median age in Mount Pleasant?
42.6, older than Charleston County’s 39.2, according to the 2020-2024 American Community Survey.
Have your say